Step by step: Flowchart in Excel

Flowchart in Excel? We teach you! Graphical representations are a simple and digestible way to visualize a group of data. This is why we present the guide you need to learn how to create this visualization that is so useful in fields such as computing, economics and even psychology.
What is a flowchart or flowchart?
A flowchart is the graphical expression of a sequence. This is based on the use of different symbols to describe the steps that will be carried out in a certain process.
What are flowcharts used for in a company?
Regardless of the sector, various types of processes are carried out in every company. In fact, these processes require be optimized until reaching the point of effectiveness and efficiency what the business requires. Therefore, the easiest way to capture them, analyze them and find opportunities is found in flow charts.

For example, if you need to study the process for hiring staff in the company, the first thing you should do is write down each step. Once ready, put that entire script into a flowchart. In this way, a glance will be enough to broadly understand the elements involved and their relationships.
The Flowcharts are an extremely useful descriptive tool, capable of saving us time in understanding and analyzing the procedures. This is how their use will facilitate the optimization of each of the tasks carried out in the different departments. You will be able to enhance the productivity of the organization!
How to make a flowchart in Excel?
Excel has always stood out for its versatility. In that sense, making a flow chart in Excel will not be a challenge if you have already done a good amount of information about the process to be represented. Additionally, if you require more technical knowledge in the tool to create more complete diagrams, you can find it in our Excel Course for Companies.

Thus, we are going to review the elements that you must take into account to create one.
1. Determine the processes
To begin, good information gathering is the key to generating an effective flow diagram for your company. This is what determining the process is all about!: fully knowing what we are going to represent so that the scheme is truly faithful to reality.
In that sense, our first step will be study the procedure that we want to bring to a flow chart, writing the sequence of steps in natural language. In short, it will be our main guide when starting to put together the diagram.
2. Know the symbology
As we mentioned before, flowcharts are based on a combination of symbols that represent the different actions that can be executed in a process. In this way, it is crucial that you know what each symbol in the nomenclature represents, in order to maintain the standard of this type of graph.
3. Add figures
Once we are clear about the process to represent and we know the nomenclature of symbols, we are ready to create our flow chart in Excel. To do this, we have two ways available to add figures.
The first is through SmartArt, a complement to generate graphic schemes such as flowcharts and that has a wide variety of figures. To access this option, just go to the menu “Insert” and then click on the “ iconGraphics SmartArt" from the section "Illustrations”.
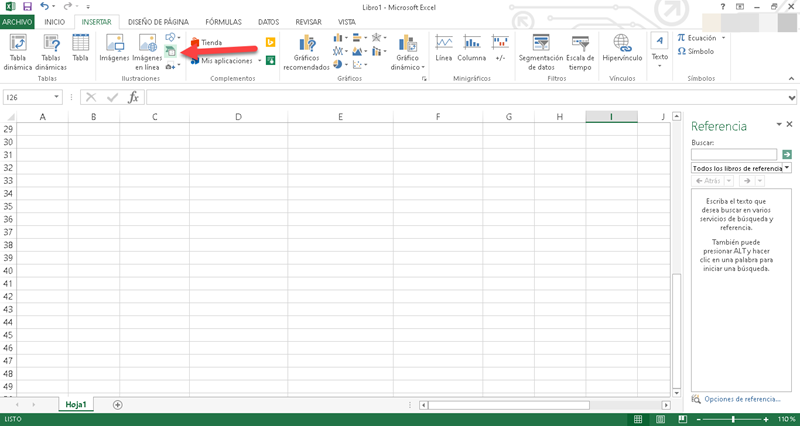
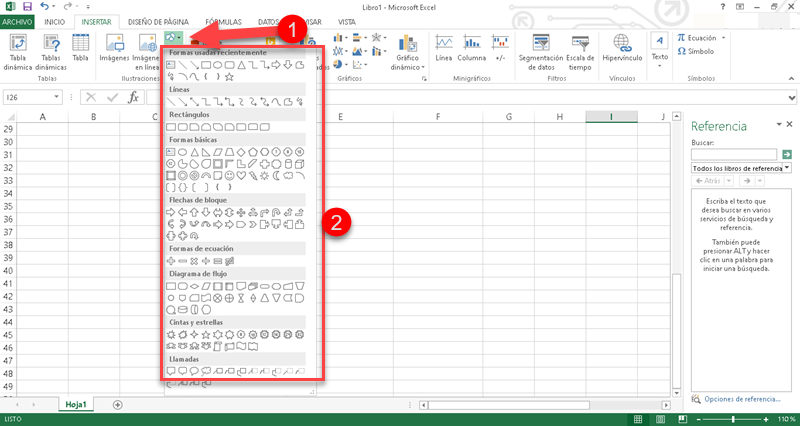
The second alternative is through the Shapes catalog found in the “Illustrations” section of the “Insert” menu. When you click, a box and a section dedicated entirely to figures will be displayed to make a flowchart in Excel.
Ninja Tip: In our opinion, the simplest option with the best results is to SmartArt 👀
4. Add descriptive text
If you have occupied the graphics of SmartArt, adding text is just a matter of double-clicking on the block in question.
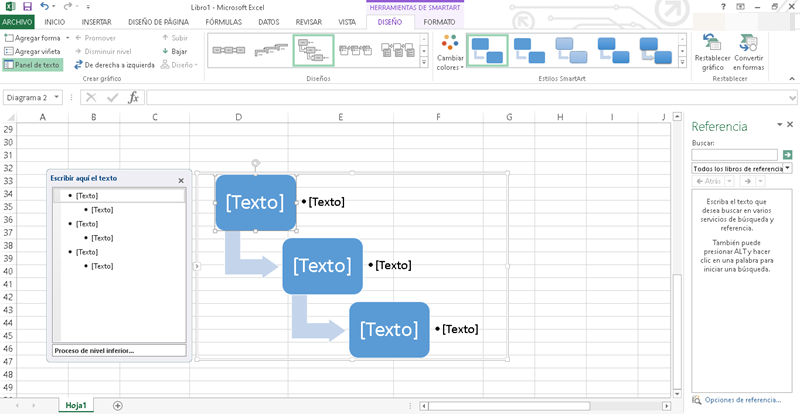
And in case you have to enter a lot of information, don't worry! As you type, the font and text size will automatically adjust. In addition, you can add bullets and the characters you need. Thanks for existing, Excel.
5. Add lines
The lines will allow you to establish connections between the different elements of the flowchart in Excel. Then, to add them, go to the “Insert” menu and click on the “Shapes” icon in the “Illustrations” section. There you will find a huge catalog of lines to add to your diagram.
6. Customize the format of your flowchart in Excel
You may have noticed that when adding the figures from SmartArt or from Forms, two new tabs are enabled in the menu bar: “Design” and “Format”. These two options will give you everything you need to customize the format of your flowchart.
Frequent questions
Flowcharts have a very wide range of elements that can be used for their construction. Therefore, we will mention the ones you will see most frequently:
Start / End or Terminator: represented by a rectangle with curved corners and means the final beginning of a process.
Flow line: This is an arrow that indicates that the process maintains a coherent order, indicating where the next instruction is directed.
Process: This element is represented by a rectangle and indicates the execution of any operation.
Decision: It has the shape of a rhombus and indicates that at this point a situation with two possible paths must be analyzed. True and False notation is used here.
These can be differentiated according to the way in which they are represented in space. In that sense, we have the following flow charts:
1- Vertical: where the flow of the actions that are executed go from top to bottom.
2- Horizontal: unlike the previous one, operations are represented from right to left.
3- Panoramic: occupies all available space, with a combined horizontal and vertical flow of operations.
The process map in Excel is a document that concentrates all the processes carried out in a company and all their interrelationships. Unlike the process diagram that contemplates only one task, the map meshes all the processes carried out by the organization for its operation.

Vito Hernandez
Graduate in Social Communication and Journalist. Mainly creative before everything. Now writing about Excel and Human Resources for the common man.