Microsoft Excel for your sales reports

Wear Microsoft Excel for your sales reports It is a fundamental step if you want to reduce both the margins of error and processing times.
What is a sales report?
The sales report is a report that concentrates the commercial transactions carried out in a company in a specific period of time.
What is an Excel sales report for?
Firstly, we have the value that the tool itself provides, facilitating the creation of the report and greatly reducing the margin of error.
On the other hand, there is the usefulness that the sales report offers as a report designed to provide information on the status of transactions and reinforce the importance of the Excel for business. In this way, the report allows you to track the performance of the sales team and monitor the status of the goals set.
What elements should your sales reports in Microsoft Excel include?
Before starting to create sales reports in Microsoft Excell, it will be necessary to take into account a series of necessary elements. However, these will also depend on the type of report you want to make.
Sales summary
A basic sales summary involves 3 essential elements:
- Level or amount of sales achieved.
- Growth level in the selected time period.
- Percentage of growth in the selected time period.
Profit and Loss Report
Profit and loss reports are another format related to sales reports. It addresses everything related to gaining and losing customers. It involves the following elements:
- Number of quotes made.
- Objectives or goals set.
- Established annual closing rate.
Contacts report
In any company, sales depend on customers and in that sense, a contact report allows you to know the panorama of the organization in relation to its permanent and potential customers. Therefore, consider elements such as:
- Contact names.
- Industry to which they belong.
- Dates on which communication was established.
How to make a sales report in Excel?
If you are looking for how to make reports in Excel, you should know that it is a fairly simple process and below we will show you the steps to follow.
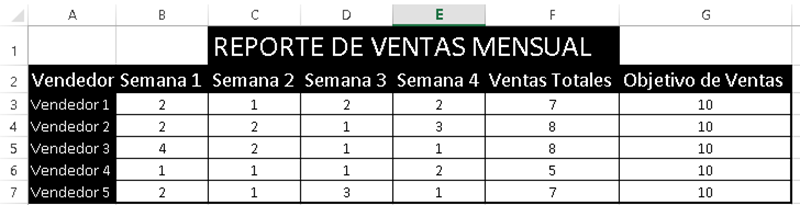
Create and complete a data table in Excel
Generate a table with the transactions carried out by each member of the sales team. To do this, create a column with the number of sales made, total sales and target sales.
Choosing the graph for your sales report
Next we will choose a graph to represent the data in the table in a more digestible way. To do this, follow these steps:
- Go to the “Insert” menu.
- Select the entire table you just created.
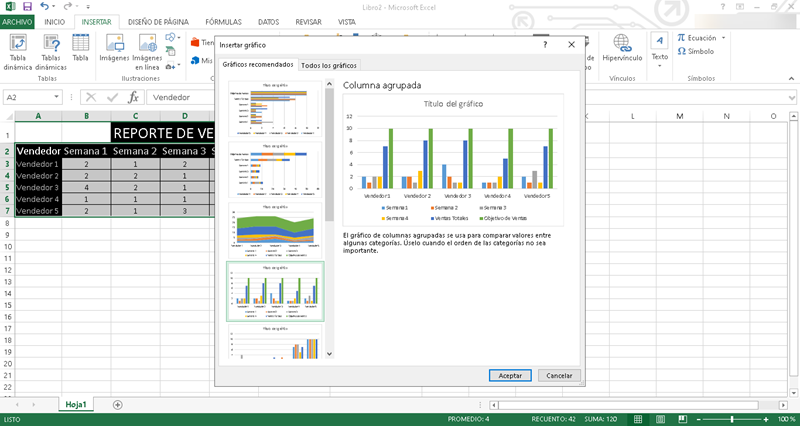
- Click on the “Recommended graphics” button or on any tab in the “Graphics” section.
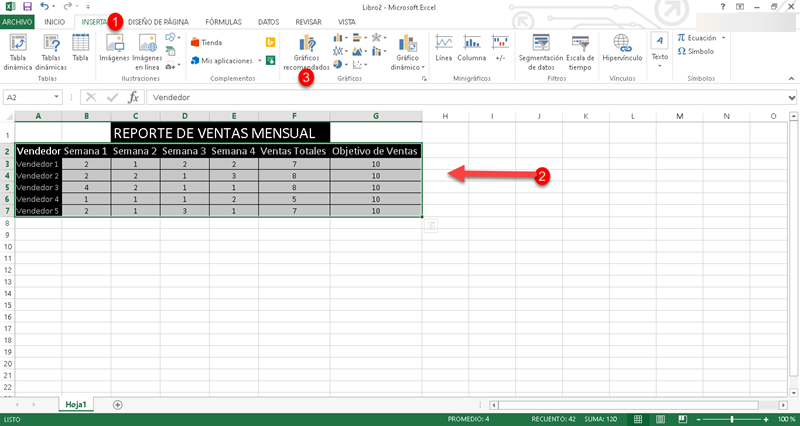
A whole series of options will immediately be displayed, select the one that best suits your needs and click accept.
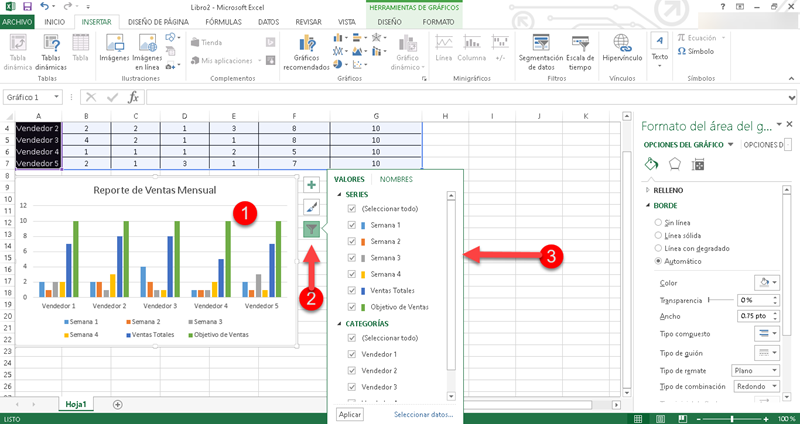
Design graphics according to the items to highlight
If what you want is to customize the aspects to be shown in your graph, it is just a matter of doing the following:
- Click above the graph.
- Click on the filter icon that will appear on the right side.
- Select or uncheck the items you want.
Periodically update the data table
Finally, you must take into account updating the data table in order to keep the report always up to date and with the correct information.
Examples of sales reports in Microsoft Excel to use in your company
Although creating our own table and graph for a sales report in Excel is simple, we can make it even easier with the use of templates.
Daily sales report in Excel
The daily sales report in Excel is one of the most specific expressions of the information on a company's transactions. If you need detailed monitoring of your business's sales, follow this link to obtain the template that will help you achieve this.
Weekly sales report in Excel
If what you are looking for is a broader view of your company's transactions, it is best to create a weekly sales report. In this link you will find a template to get you started.
Monthly sales report in Excel
In the case of the monthly sales report, we are obtaining a panoramic and much more general vision. It is very useful for setting medium-term objectives and if you want to create a report of this type, you can download a template at this link.
Related questions
Making a report in Excel with pivot tables follows a process similar to the one we discussed to create a graph. In that sense, you will only have to select your data table, click on the “Dynamic Charts” button and follow the steps of the wizard.
From Excel it is possible to create any type of sales report: weekly, monthly or daily. Additionally, there is the possibility of generating any type of format, so you can also make contact reports, sales summaries, income reports and more.

Vito Hernandez
Graduate in Social Communication and Journalist. Mainly creative before everything. Now writing about Excel and Human Resources for the common man.