How to make a risk matrix in Excel? Discover it here

Starting a project will always involve a lot of planning and the risk matrix tool in Excel can help you. In fact, it is a fundamental instrument that will allow us to respond to those variables that threaten the continuity of operations. For this reason, in this blog you will discover how to use the risk matrix in Excel. Here we teach you!

What is a risk matrix?
A risk matrix is an instrument that allows us to classify and prioritize the setbacks to which the project is subject. Its great advantage is that it allows us to objectively evaluate the threats that surround the project, with the purpose of mitigating them and being prepared to address them.
What is the purpose of creating a company risk matrix?
As we mentioned before, projects are always based on a strong planning factor. In that sense, the risk matrix is a tool that provides the possibility of knowing an aspect as important for the continuity of operations as the risks under which the activities are executed.

With this instrument we can record and analyze all the variables that could be threatening for everyone involved in the project. In this way, it is possible to anticipate or mitigate the impact of any inconvenience while driving.
What elements should a hazard identification and risk assessment matrix contain in Excel?
Creating a risk analysis format in Excel is a fundamental task for any project. The Microsoft tool provides everything we need to easily generate it and also for its visualization and analysis. In that sense, we are going to review the elements that you must consider to make one.

Risk identification
The first element we must include in our hazard identification and risk assessment matrix in Excel is risk identification. This is a fundamental step because it allows us to determine what threats are found around the project's operations.
The activities that will be carried out in the company must not only go through risk identification, but once determined, they will have to be classified by their priority level.
Probability and impact of risks
Another fundamental element for a risk assessment matrix in Excel is a space oriented to the probability and level of impact generated by threats. In this sense, it is possible to establish a scale from 1 to 4, where 1 indicates the lowest probability and 4, the highest. For its part, the impact can be determined as Low, Medium or High.
This is important because it allows us to give greater clarity to the events or risks that we are trying to mitigate or anticipate.
Risk management quality
This point refers to the mechanisms established by the organization to anticipate, mitigate or solve the problems identified above. The idea is to minimize both the level of impact and the probability of certain setbacks appearing. In that sense, this element will allow us to make an objective assessment to know the situation of the project in the face of these problems.
Calculation of net or residual risk
The net or residual risk is nothing more than the result of risk management in the face of their presence. It is a qualitative or quantitative expression, product of the evaluation of the mechanisms established to address risks, when these appear. Therefore, a risk evaluation matrix in Excel contemplates this element with the purpose of measuring the effectiveness of the planned actions.
How to make a risk matrix in Excel?
Once we know the elements that we must consider, we are going to review how to prepare a risk matrix in Excel in the simplest way.
Prioritize identified risks
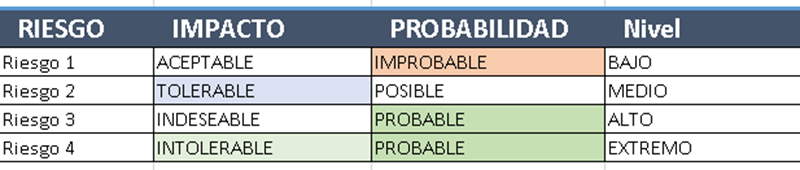
The first step to generate your risk matrix in Excel will be establish a priority level for the risks we identified earlier. The data to identify the priority can be quantitative or qualitative, that is, it is possible to use a numerical scale or values such as High, Medium and Low.
This will depend on the needs and preferences of the project manager; the important thing is that the instrument is expressed clearly and allows it to be analyzed.
Evaluate probability and impact
Next, we will continue to evaluate the identified risks, but this time to determine the probability of its occurrence and the impact it would generate. This is something that must be analyzed carefully and precisely in order to give the importance it deserves to each of the detected threats. It should be noted that here you will also have to establish a notation for the purpose of identifying probability and impact levels.
Graphically represent the evaluated risks
This point, although optional, is really useful because it allows a more digestible view of the risk matrix. After you have the threats identified and categorized by their level of probability, priority and impact, you must make a graph using this data as a reference.
If you want to know more about how to generate graphs from a group of data, you can go to our Basic Excel Course.
Related questions
If you manage a risk analysis based on quantitative values, you can use the following formula to calculate the risk in Excel:
Risk = Probability x Impact
Risk analyzes can be of type:
Qualitative: where the probabilities, impact and priorities are established by the parameters Low, Medium and High.
Semiquantitative: Elements are identified and categorized with numerical, linear and logarithmic scales.
Quantitative: is based on the use of real numerical scales.
According to the types of risk analysis that we saw previously, we can say that it is feasible to create risk matrices adapted to each one. Excel is a very versatile tool and can help us generate these instruments according to our needs.

Vito Hernandez
Graduate in Social Communication and Journalist. Mainly creative before everything. Now writing about Excel and Human Resources for the common man.