Excel data table: play with different scenarios

1. The basics of Excel data table
What is an Excel data table? An Excel data table is a set of cells that, combined, give us specific information.
What is an Excel data table for? It is used to see the change in the results when different variables are modified.
You can make Excel data tables with one variable or two variables, depending on the number of parameters we want to change.
2. Excel data table of one variable
An Excel data table of one variable is a table where only one parameter is changed to see the change in the final result.
Let's imagine the following example, where we have a budget of $ 5,000 to buy bread. A kilo of bread costs $ 1,500. Initially we bought only a kilo of bread.
The following image shows the data.
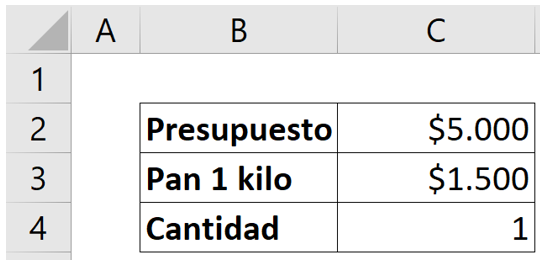
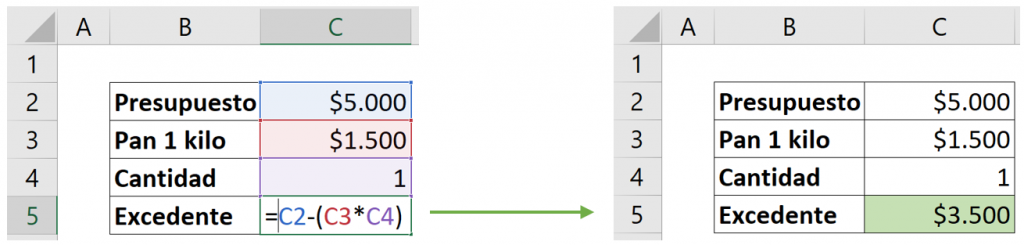
We want to know how much of the budget we will have left after buying a kilo of bread. Therefore, we perform the following calculation shown below, leaving $ 3500 surplus.
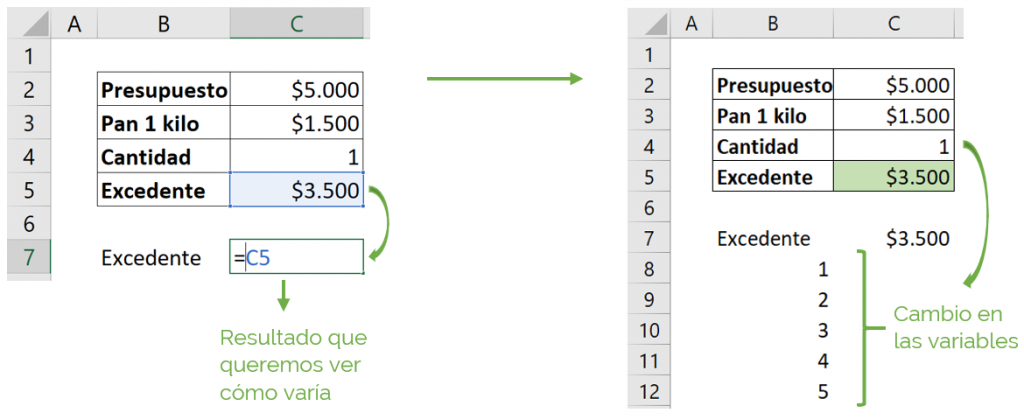
Now we want to perform this same calculation by changing the quantity variable. We want to see how much surplus we will have if we buy 2 or more kilos of bread, without having to do this calculation again.
How do we do it?
For this we create another table. In the first cell we write the surplus. Then in the next cell we put the result we want to see, according to changes in the variable. In this case, our result is the surplus. We select cell C5 that contains the surplus that we had previously removed, as the image shows.
Then, in the first column of our table, we write down the alterations in the variable. In this case, the variable to modify is the quantity, therefore, we enter the kilos of bread that we can buy: 1, 2, 3, 4 and 5, as the image shows.
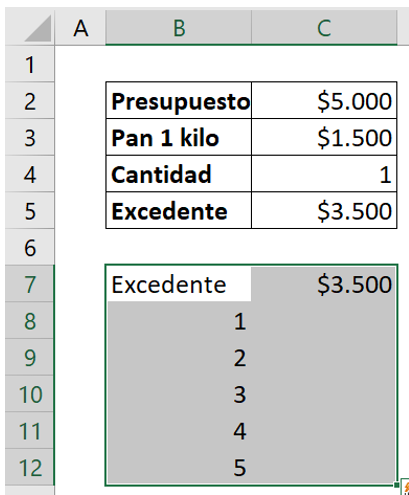
 To create our table, we select this entire range.
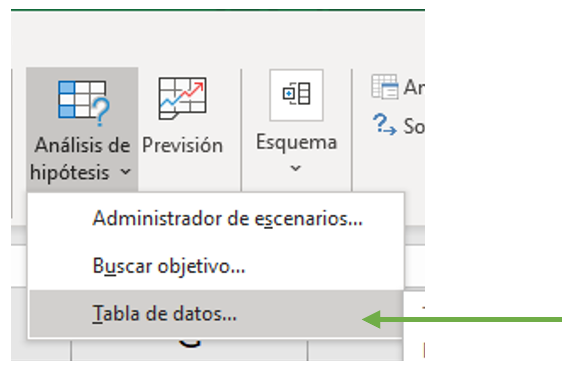
We go to “Data”, “Analysis Hypotheses”, and select “Data Table” as shown below.
The following box appears that we must fill in to create our table.
How to fill in an Excel data table?
In the input cells, select the cells that you want to replace with the new values from the table. If the new values of the variable are written in a row in the Excel data table, the cell to be replaced is selected in “Input cell (row)”. If the new values of the variable are written in a column in the table, the cell to be replaced is selected in “Input cell (column)”.
In our example, we have put the new quantities (kilograms of bread) in a column in the table. Then we will put the cell with the value of the quantities (C4) in “Input cell (columns)”, as the image shows.
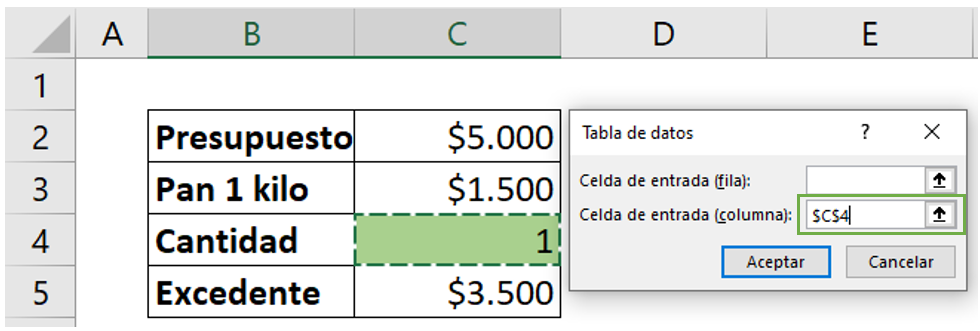
Thus, the values 1, 2, 3, 4, 5 will replace the value 1 in “Quantity”, changing the value in the “Surplus” formula and thus changing the result. We click on “Accept”.
The complete table appears, with all the results in the different scenarios, it's that simple!
And without having to calculate one by one!
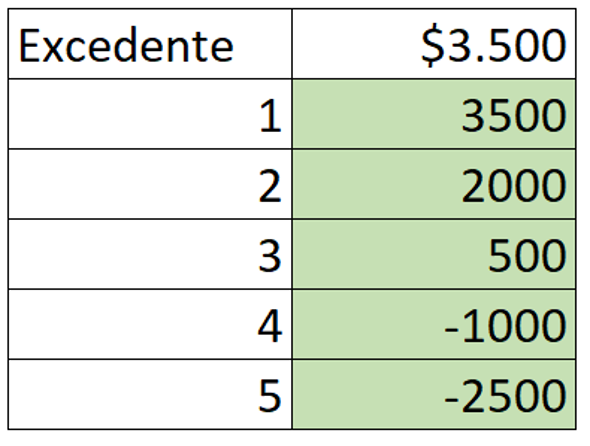
We see the different surpluses in our table, depending on the number of kilos of bread we buy.
In this case, for example, we will not be able to buy 4 or 5 kilos of bread, because the budget is not enough.
3. Excel data table of two variables
A two-variable Excel data table is a table where two parameters are changed at a time to see the change in the final result.
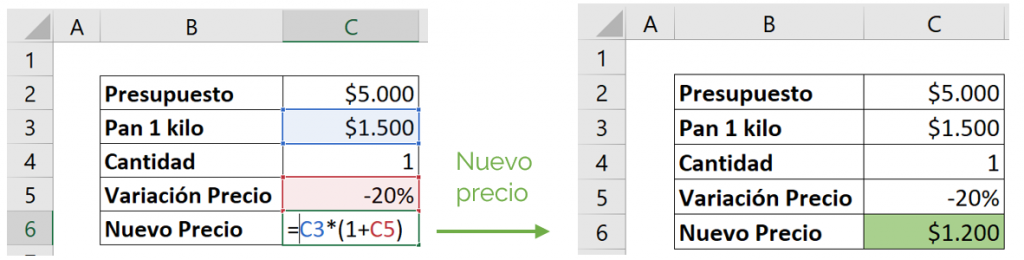
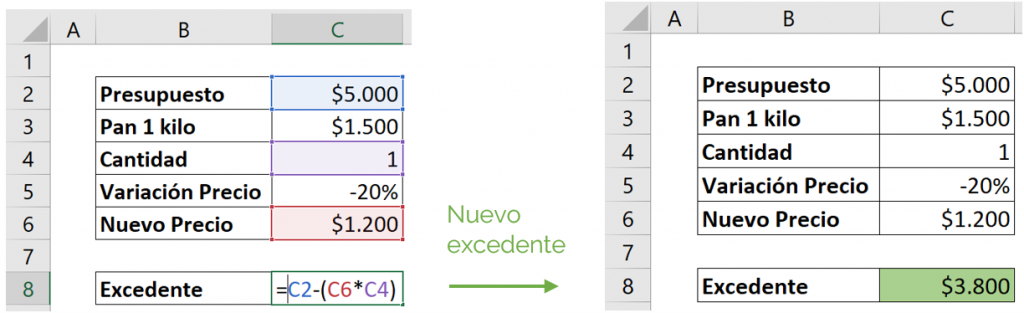
In our example, let's imagine that the price of a kilo of bread will have a variation in the next month, decreasing by 20%.
For this, we calculate the new price, as the image shows. We have $ 1200 left.
We also need to calculate the new surplus with the new price, as shown below. We have $ 3800 left.
Let's imagine that in the next 5 months the price of a kilo of bread will have different variations.
Next month there will be a 20% decrease in price, the following month -10%, then 0%, then there will be an increase of 10% and finally 20%.
Now we want to see in our Excel data table, how our surplus changes by changing 2 parameters; the quantities and price per kilo of bread.
We make a table with double entry.
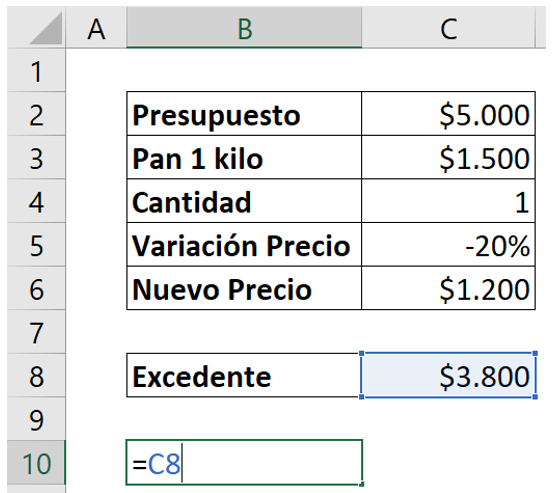
First of all, we insert into the first cell the value of the surplus that we have had, as shown in the image.
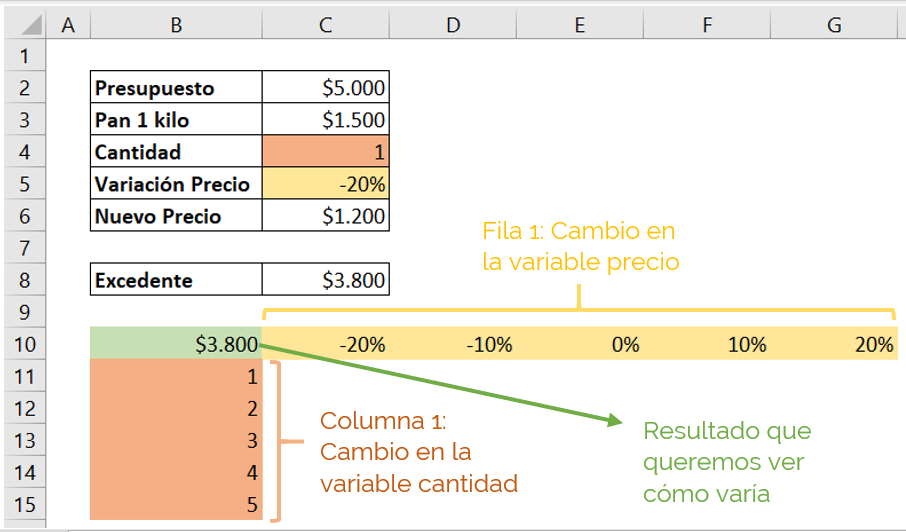
In the first column of our Excel data table, we fill down the change in variable 1: “Amount”.
On the other hand, in the first row of our Excel data table, we fill in the changes in variable 2: “Price Variation”.
As it's shown in the following.
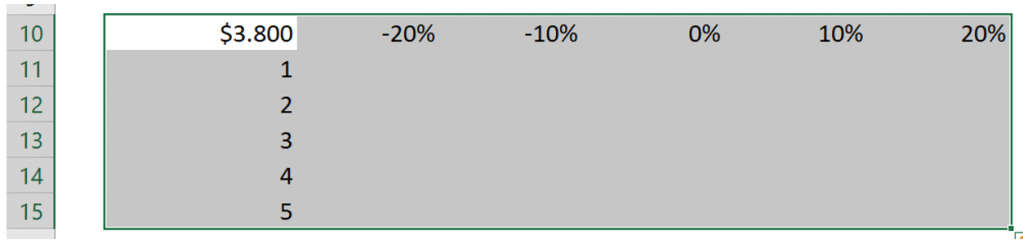
 To complete our Excel data table, we select this entire range.
 Let's go to “Data”, “Data Analysis”, “Data Table”.

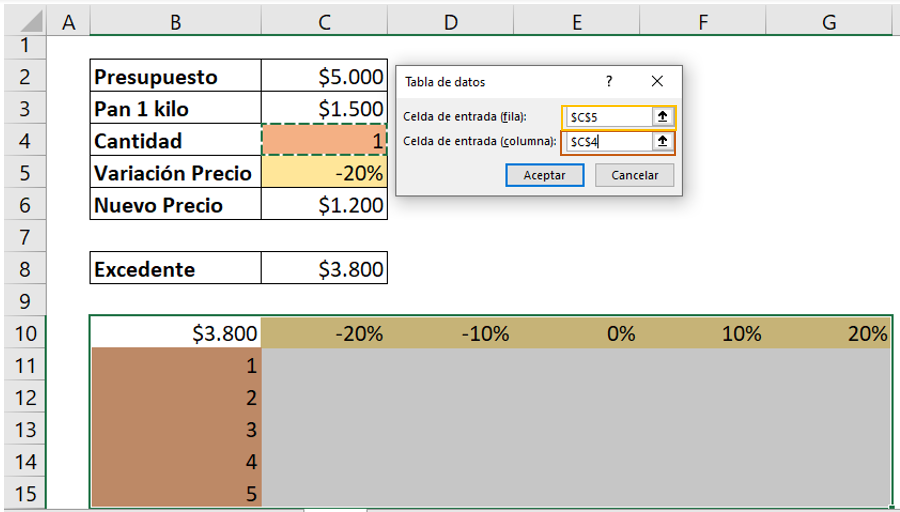
The box appears to fill in the table.
How do we fill an Excel data table with two variables?
In the input cells, the cells that will be replaced by the new values from the Excel data table are selected, depending on where they are located (rows or columns).
In our example we want the “Price Change” value of -20% to be replaced by -10%, 0%, 10% and 20% to show how the surplus changes.
As we put these values in a row in the Excel data table, we will put in “Input cell (row)”, the cell with the value of the price variation C5 (yellow color as picture shows).
Like the previous example, we have the values of the new quantities in the same column in the table.
Therefore, we will put in “Input cell (column)” the cell with the value of the quantity C4 (red color as picture shows).
 We click “Accept” and we are left with the Excel data table with all the variations and the different results!
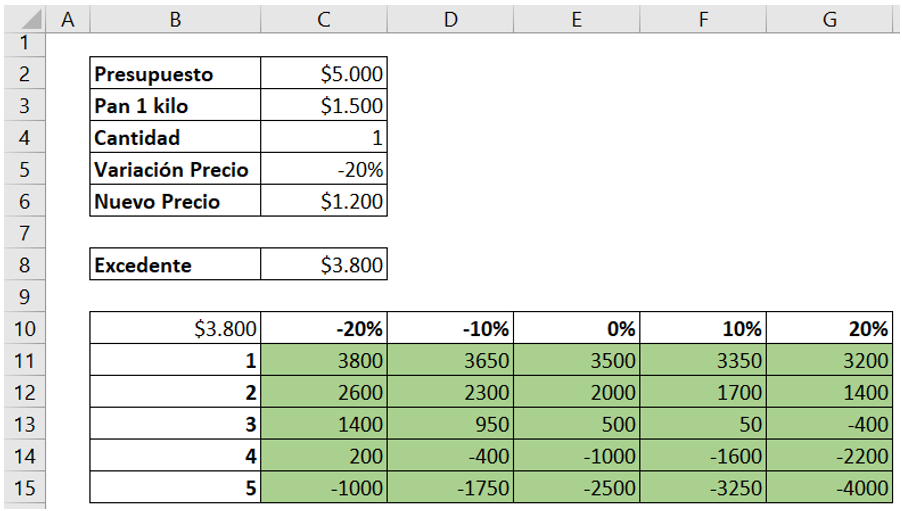
We can observe, for example, that next month we will be able to buy 3 kilos of bread without any problem, leaving us with 1400 as surplus and being able to buy something else.
But in 5 more months we will not be able to buy 3 kilos of bread because the price will increase and the budget will not be enough, leaving us with a negative surplus -400. In that case we would have to buy less than 3 kilos.
Thus we can see, in a simple Excel data table obtained quickly, different scenarios with changes in the variables. We can compare, analyze and draw conclusions from these results.
Tip Ninja: Being an array formula, if you try to delete a single result in the table, Excel will not allow it. Therefore, to delete results within a table, you must delete the entire range and delete.
Frequent questions
To create a data table we must 1. Select the data that the cell will include 2. Use the shortcut CTRL + Q 3. Click accept and that's it!
In tables, the data is organized in rows and columns, similar to spreadsheets, this allows them to contain all types of information. Each row represents a unique record and each column a field within the record.
A Table is an arrangement of data in rows and columns, its main use is for database management, data analysis and research.
