Standard deviation in Excel: How to easily calculate it

Key information
The standard deviation is a measure used to quantify the dispersion in a data sample. Depending on whether we use a sample or population, we must use different Excel functions, in addition to taking into account whether we consider text and logical values. Excel will take the arguments to calculate the standard or typical deviation according to the formula we decide.
What is standard deviation?
The standard deviation - also known as standard deviation - is a measure used to quantify the dispersion in a set of data. This variation is calculated with respect to the average (mean) of the set. Thus, a low standard deviation means that most of the numbers are clustered near their mean, while a high standard deviation means that they spread over a larger range.
We can see in the following example, where we use Excel to calculate the mean and standard deviation, that both groups have the same mean. However, they have different standard deviations:
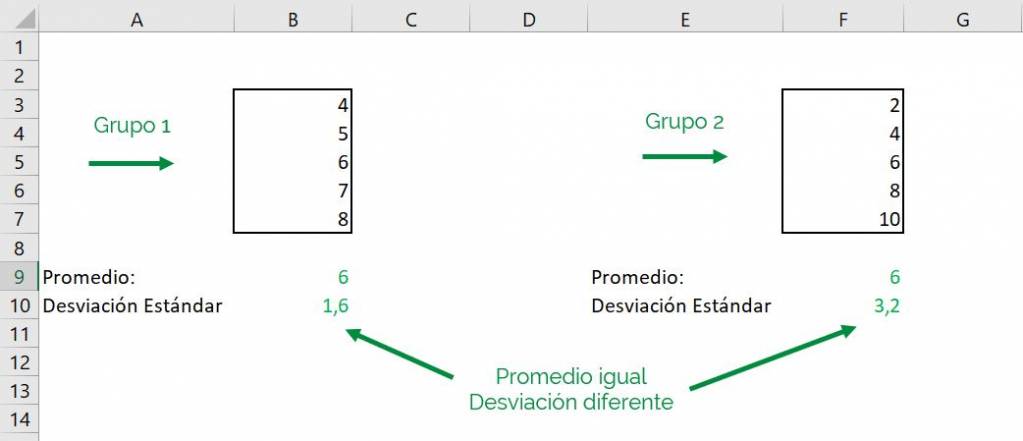
We see that this is because the numbers in group 2 are further away from the group average, which corresponds to 6. Therefore, we say that this group has a greater standard deviation.
Let's now add a third group to the example:
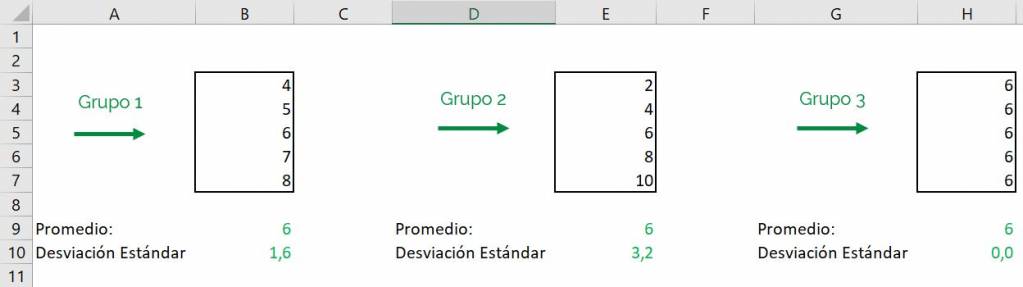
We can see that the third group maintains the average of the other 2, but with a standard deviation of 0. This is because all the numbers are the same, so the average is the same and thus the dispersion with respect to that number is null.
Calculating standard deviation in Excel
Depending on whether we calculate the standard deviation of a sample or a population, we must use different functions. In the case of a sample, that is, a group within a population, we must use DESVEST M and in the case of the total population we must use DESVEST P.
Ninja Tip: The “M” at the end of the name STDEV M refers to the fact that it is used in samples, while the “P” at the end of STDEV P is because it is used in populations.
This means that if we are calculating the standard deviation of salaries for an entire company, we use DEVEST P, since it corresponds to the entire population. On the other hand, if we have only a smaller group of these salaries, we use DESVEST M.
We can see in the following example that calculating the standard deviation with these 2 functions gives us different results:
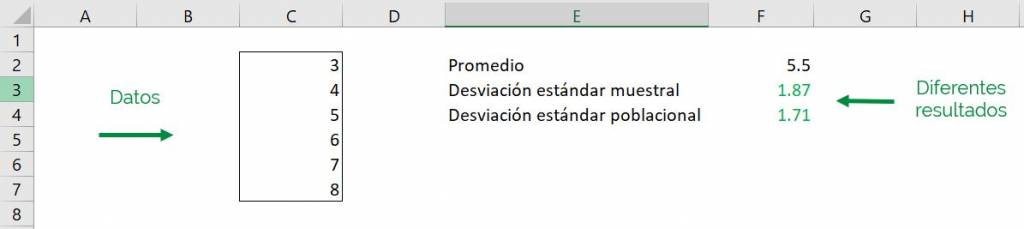
Ninja Tip: As the number of data used in the standard deviation calculation in Excel increases, the difference between these two functions will become smaller.
If you are interested in learning about the differences between using a sample and a population see this article.
Excel STDEV MY STDEV P: Deviation for samples and populations
The basics
Characteristics: Only the first value is required, the rest are optional. Numeric arguments can be numbers, rows, columns, or arrays. The functions ignore blank cells or those that include text.
Syntax:
=DEVEST.M(number1, [number2],…)
=DEVEST.P(number1, [number2],…)
Arguments:
- number1 = First numeric argument.
- number2, number3, … = The rest of the numeric arguments. They can be up to 255.
Using STDEV M and STDEV P
Since the functions DEVEST M and DEVEST P work the same and only differ in when they should be used, for the following examples we will use DEVEST M. However, remember that everything is applicable to DEVEST P
As we already saw in the syntax of the functions, to calculate the standard deviation in Excel only numerical arguments are needed. However, each of these arguments can be numbers, rows, columns, or arrays.
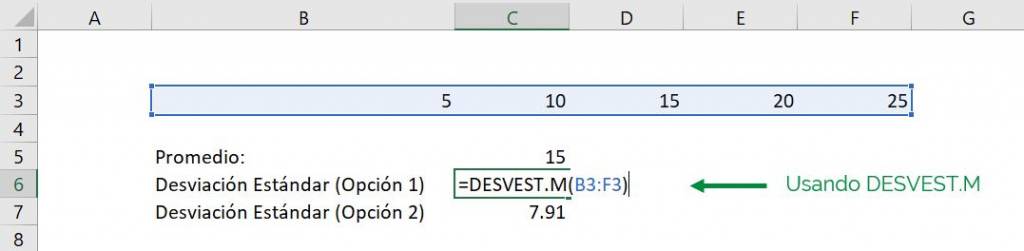
In the following example we can see that each of the numbers used to calculate the standard deviation is selected as a different argument:
Ninja Tip: Hold down the “Control” or “CTRL” button (“Command” or “Cmd” if you are using a Mac) to select new data without erasing previous selections. This is very useful for selecting large numbers of data that are not necessarily linked together.
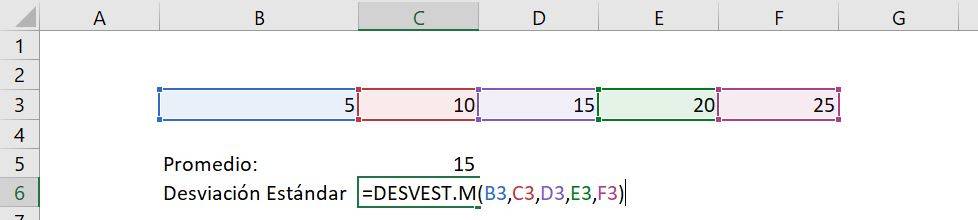 Here cell B3 corresponds to the first argument (5), cell C3 to the second and so on. This will result in the following:
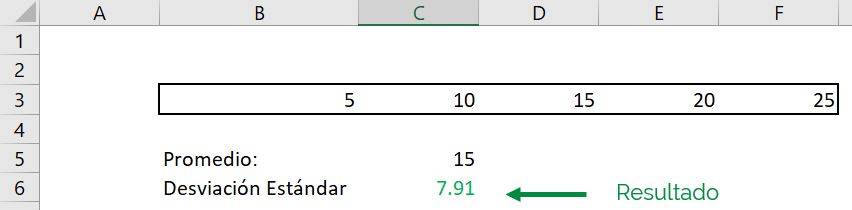
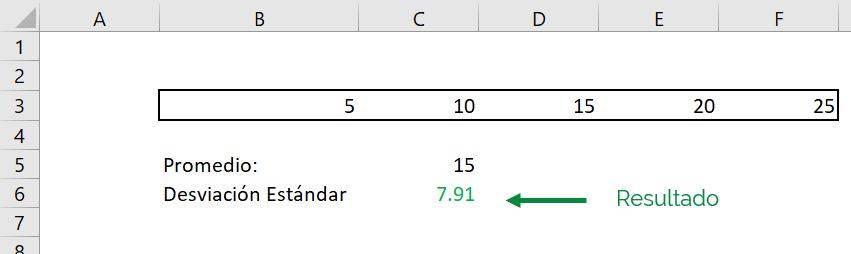
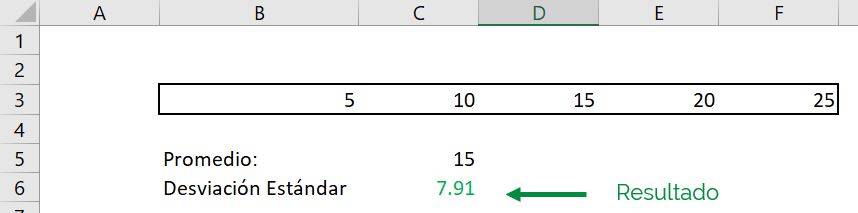
If now to calculate the standard deviation in Excel we select the entire line as a single argument, we will obtain the same result:
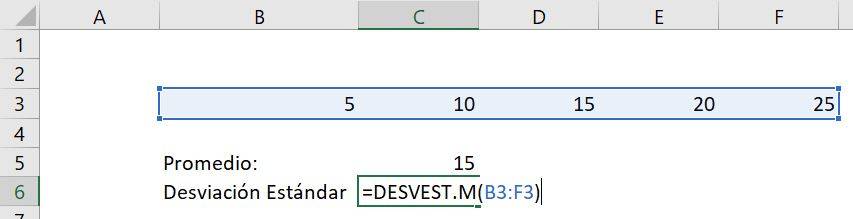
As we can see, we obtain the same 7.91 as the first example:
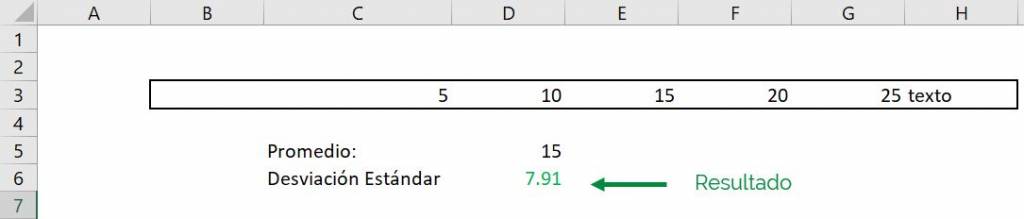
Another important point when calculating the standard deviation in Excel is that the STDEV M and STDEV P functions omit blank cells and cells that contain text when calculating the standard deviation.
In the following example we add a blank space and a box that says “text” to the range used to calculate the standard deviation.
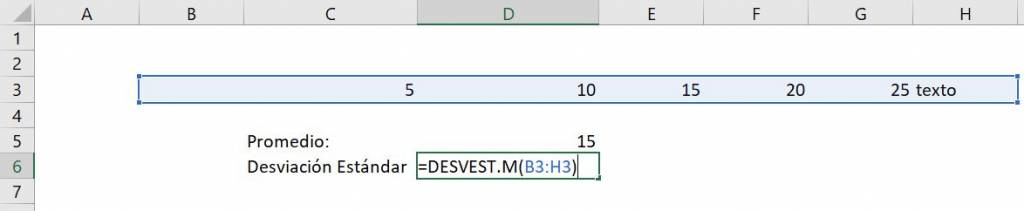
We see that Excel gives us the same standard deviation as before:
Difference with the Excel functions DEVEST and DEVESTP
We may be wondering what the difference is between Excel functions DISCLOTHING AND DEVEST M. Both functions do exactly the same: provide the sample standard deviation (or typical deviation) in Excel.
In the same way, DEVEST P does the same that DEVESTP,deliver the population standard deviation in Excel.
The functions DEVEST M and DEVEST P correspond to updated versions of DEVEST and DEVESTP respectively. However, Microsoft decides to continue including both versions in Excel, so that they are compatible with previous versions of the program. However, they recommend that when calculating the standard deviation in Excel you use DEVEST MY DEVEST P, since they have better performance and their names more closely reflect what they are used for.
As the example shows, we obtain the same result using STDEV AND STDEV M:
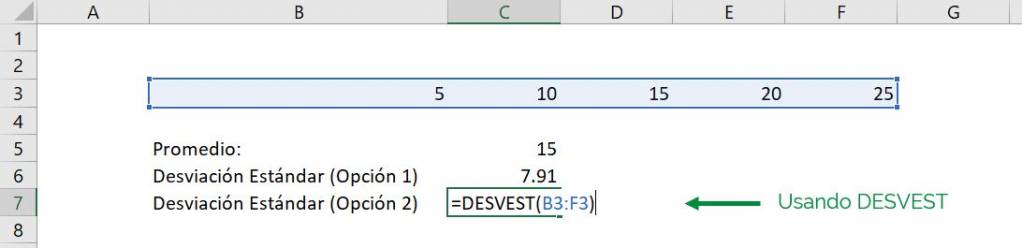
As we see, both Excel functions return 7.91 as the sample standard deviation.
Excel DEVEST and DEVESTPA: Calculating standard deviation including text and logical values
The basics
Purpose: UNDRESTED It allows us to obtain the standard deviation of a data sample, but considering text and logical values. DISVESTPA does the same thing, but for a population of data
Characteristics: Only the first value is required, the rest are optional. Unlike M-DEVEST and P-DEVEST, the arguments are not just numbers, but also text and logical values.
Syntax:
=UNDRESS (value1, [value2],…)
=DEVESTPA (value1, [value2],…)
Arguments:
- value1 = First argument. It can be number, text or logical value.
- value2, value3, … = The rest of the arguments. They can be up to 255.
Calculating standard deviation including text with DEVEST and DEVESTPA
Unlike with DEVEST M and DEVEST P, when calculating the standard deviation with DEVEST the cells that have text will be considered by the function as cells with a value of 0.
In the following example, we use the same numerical range as in the STDEV M example:
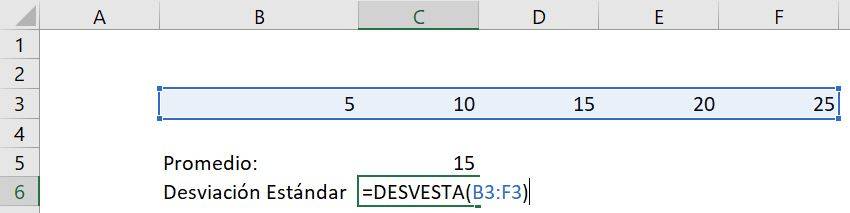
And so we get the same standard deviation:
But, by now including a cell that says “text” (here it could be any word):
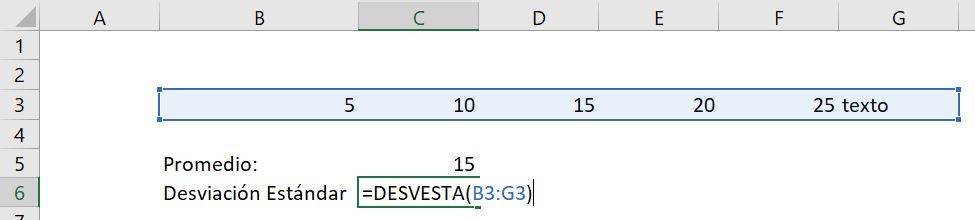
We see that Excel now returns a different standard deviation:
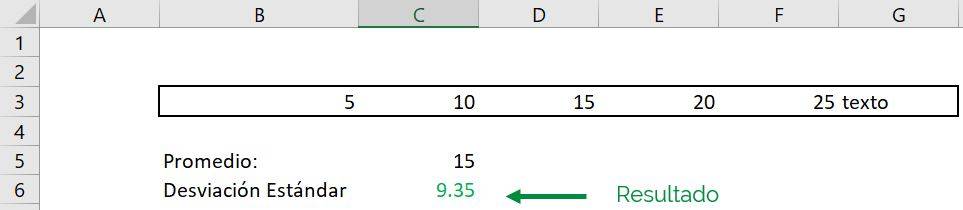
Which means that the standard deviation increased from 7.91 to 9.35. This occurs because the “text” box takes the value 0, which is relatively far from the average of 15, so the standard deviation increases.
Calculating standard deviation including logical values with STDEV and STDEV
The STDEV and STDEV functions also take into account logical values (true or false) when calculating the standard deviation in Excel.
If we use a “TRUE”, Excel will recognize it as a 1, while if we use a “FALSE”, it will recognize it as a 0.
If we go back to the previous example and replace the word “text” with “FALSE”:
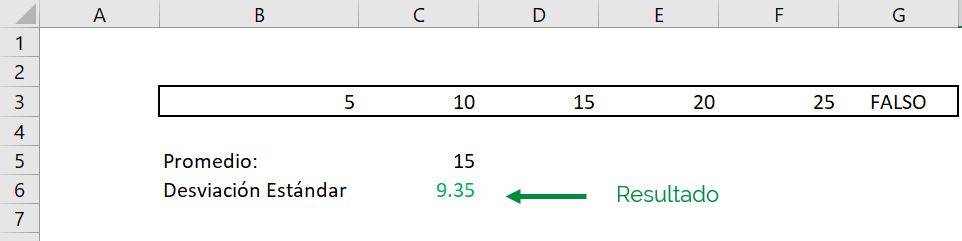
We get the same result as before, since Excel recognizes “FALSE” as 0, just like “text.
However, by replacing “FALSE” with “TRUE”:
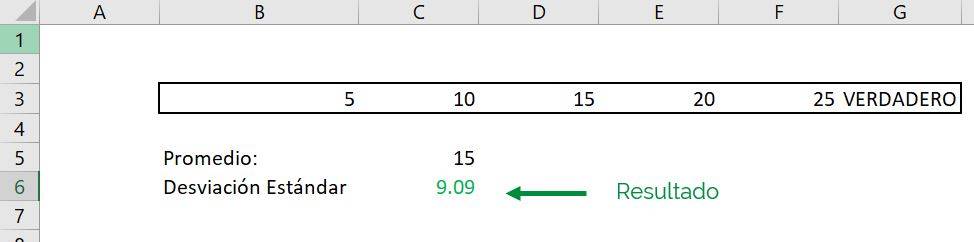
The standard deviation calculated by Excel decreases to 9.09. This makes sense because 1 (“TRUE”) is closer to the average (15) than 0 (in the case of “False”).
Summary of Excel functions to calculate standard deviation.
| Function | Type of data | Considers text and logical values | updated version |
| DISCLOTHING | Sample | No | No |
| UNDRESS.M | Sample | No | Yeah |
| DEVESTP | Population | No | No |
| UNDRESTS.P | Population | No | Yeah |
| UNDRESTED | Sample | Yeah | Yeah |
| DISVESTPA | Population | Yeah | Yeah |
Frequent questions
After having all the data grouped, we click on the cell that will carry out the calculation of the standard deviation and add the formula =desvest(A1:A15) to obtain the result
The numerical index of the standard deviation shows the dispersion of a data set. The greater the standard variation, the greater the dispersion of the population.
Standard deviation is a measure used to quantify the variation or spread of a set of numerical data.

Christopher Diaz
Commercial engineer and Master in Finance from the Pontifical Catholic University. Special interest in topics related to corporate finance, private equity and real estate investment.