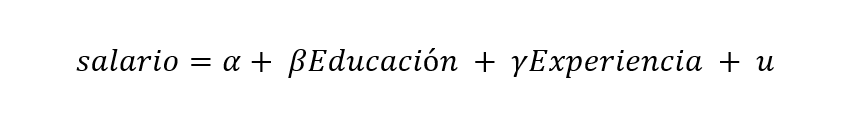
Linear regression in Excel: Learn, calculate, interpret

The basics
What is the relationship between years of education and salary? Does it also affect experience? A regression analysis allows you to calculate the numerical relationship that exists between salary and the set of characteristics that can affect it, such as education, experience or the field in which you work. You can apply this analysis for any set of variables you want, even non-numeric ones!

To achieve this you need to have enough information for the estimate to be reliable. How much is enough? The rule of thumb is 30. That is, for the previous case, we need a minimum of 30 people for whom we have information on their salary, years of education, experience and field where they work. If you have more, even better! The estimate will become more and more accurate as you have more data.
Key information
- Dependent variable: it is the one on which you want to measure the effect. For the previous case, we will have that the dependent variable is the salary.
- Independent variable(s): are those that try to explain the dependent variable. In the example, we would have education, experience and field as independent variables.
- Observations: refers to the amount of data that the regression will incorporate. Each row corresponds to one observation. In the case of the example, each observation corresponds to a person (with their salary, their years of education and their experience). This does not necessarily happen this way, as it depends on the type of data we have.
- Functional form: A linear regression can be expressed mathematically as:

- Which for the purposes of the example would be the same as:
Later we will see in detail what each of these elements mean.
Linear regression in Excel in a simple way: the easiest case
A regression with only one independent variable is known as simple linear regression. To stay with the example, consider that we want to see the relationship between salary and education.
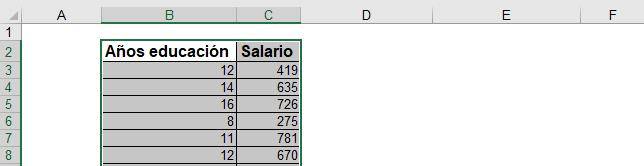
Step 1: Select the entire table with information.
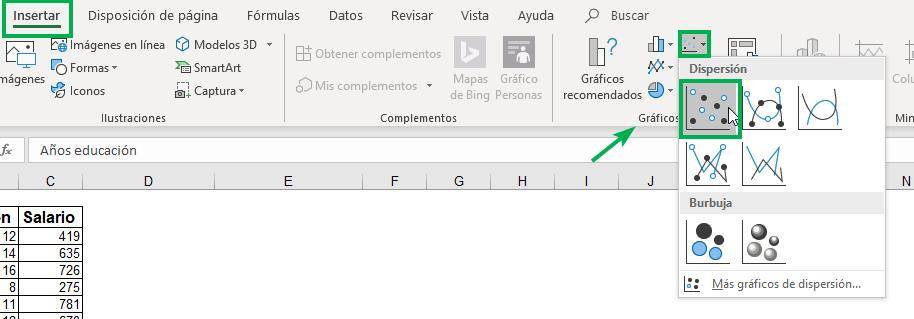
Step 2: In the “Insert” tab, go to the “Charts” section and select the first option for “Scatter”.
A graph will appear relating years of education (on the X axis) to salary (on the Y axis).
Ninja Tip: Excel understands that the column to the right of the table is the one that goes on the
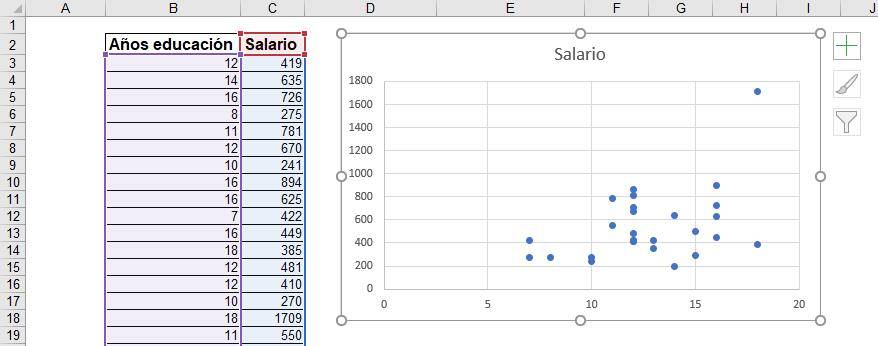
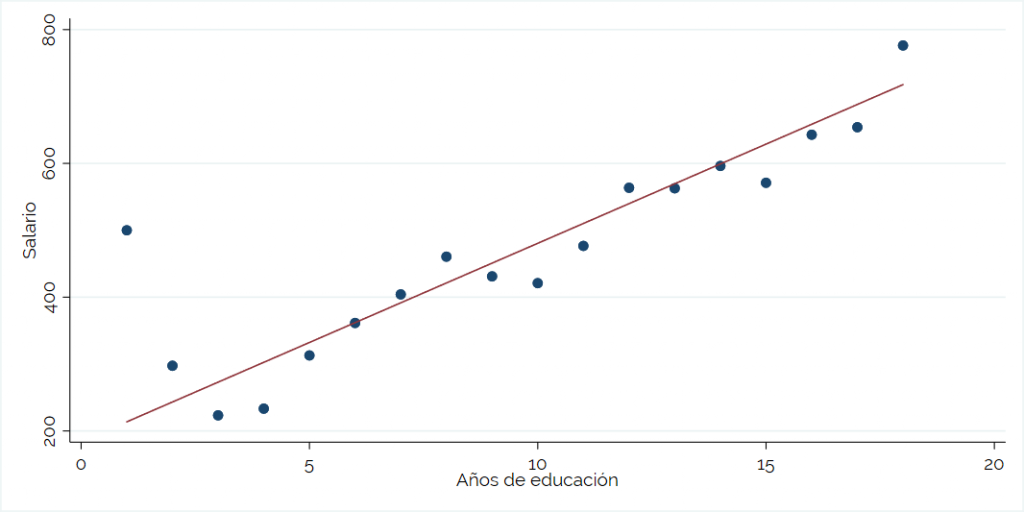
At first glance we can see that the relationship is positive.
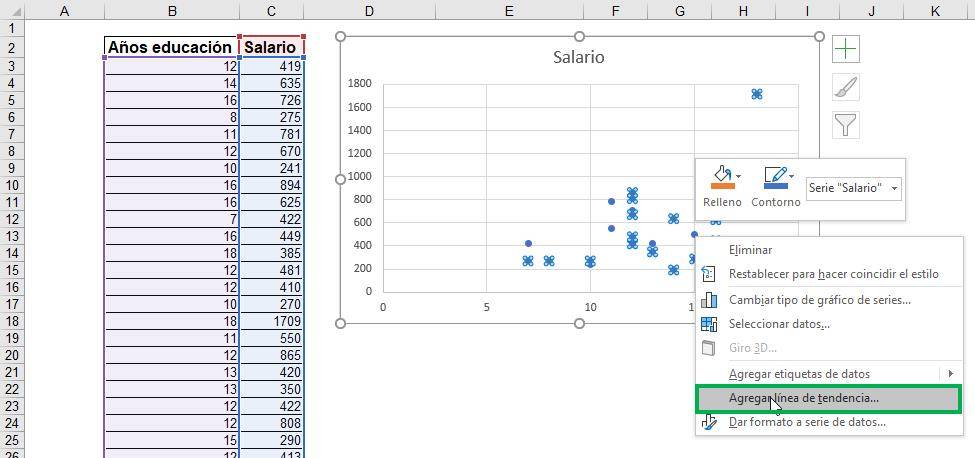
Step 3: Right click on any of the points on the graph, and select “Add trend line”. A section will appear on the right of the screen titled “Trend Line Format.”
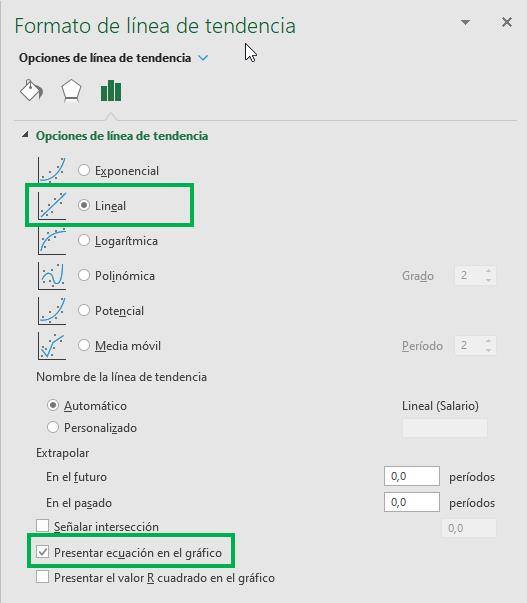
Step 4: Under “Trend Line Options,” select “Linear” and then, at the end of the section, click the “Present Equation on Chart” checkboxes.
The result is as follows.
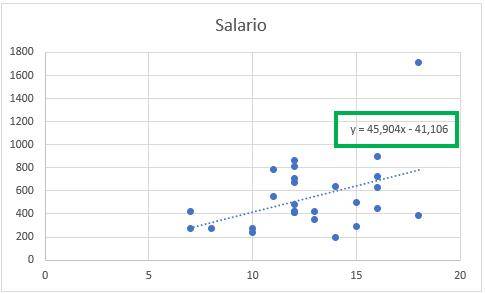
We see that the graph now includes a trend line and also the equation that shapes that line. Linear regression, then, is simply a line that tries to fit all the data as best as possible. This equation indicates that for each additional year of education, wages increase by 45.9. That is, the “x” of the equation represents the education variable, while the “y” represents the salary.
Clearly, there is an error in the estimate since not all points lie on the line. This difference is called the residual, and we will see how it is calculated exactly later.
This is a quick way to do a regression with an independent variable, but it only provides a fraction of the information relevant to doing a regression. With the data analysis package it is possible to calculate all the elements of a regression, and this is what we will see below.
Linear regression in Excel: the general case
To perform a linear regression in Excel, you first need to install an add-in that allows you to do it.
Installing the data analysis package
Step 1: In the toolbar, click “File” and then “Options” (in the lower left corner).

Step 2: In the new options window, you must select “Add-ons”. In the “Manage” section, select “Excel Add-ins” and then click “Go.”
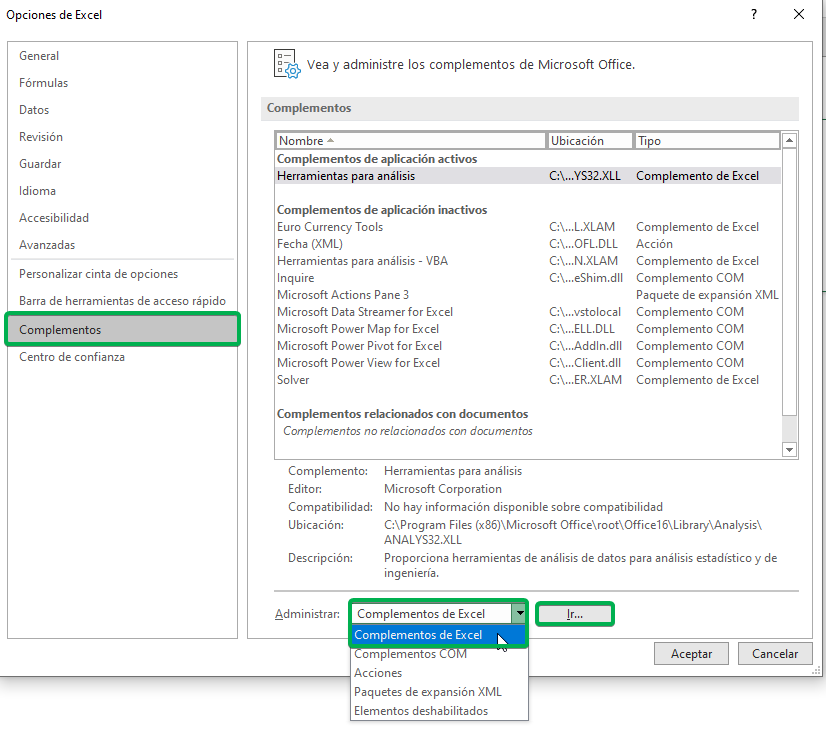
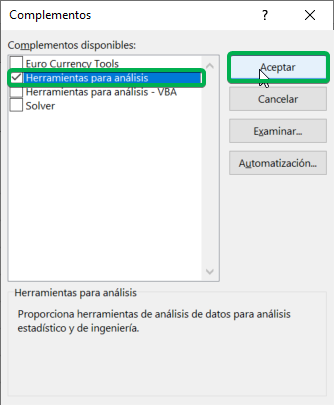
Step 3: A new window will appear, in which you must check “Analysis Tools” and then click “OK”.
If you go to the “Data” tab in the toolbar, you will see that a new section called “Analysis” has been added, which includes the “Data Analysis” tool.
Calculating a linear regression
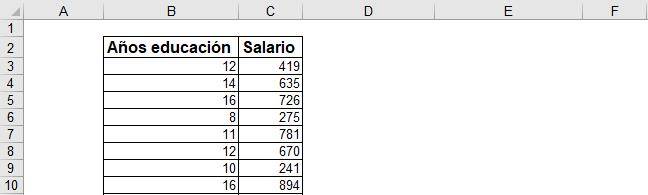
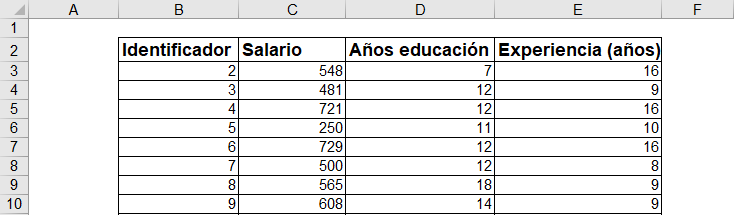
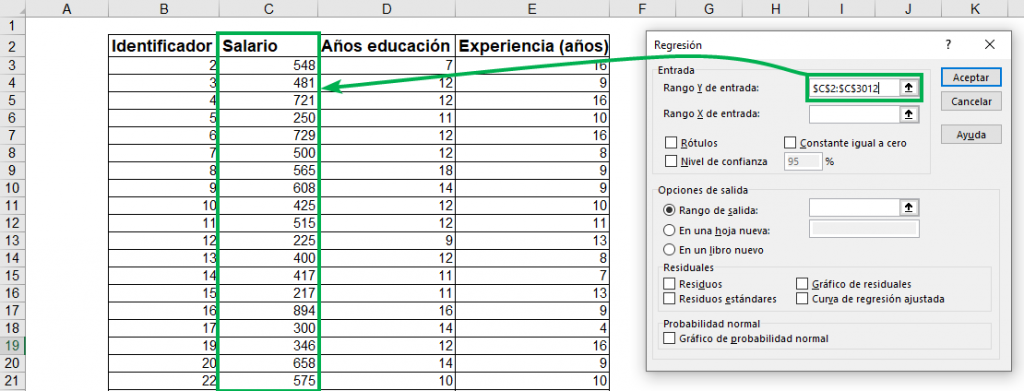
The following table contains information about different people: their salary, their years of education, and their experience. Like most surveys that collect information of this type, the database does not contain names but rather a unique numerical identifier for the individual.
Step 1: Go to the “Data” tab and click on the new “Data Analysis” tool.
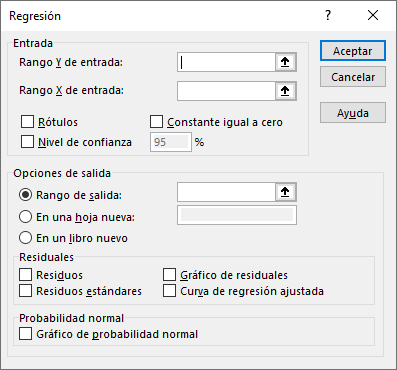
You will see that a new window will appear that you must fill out with the requested information.
Step 2: In “Input Y Range:”, select the column that has information about the dependent variable, in this case, “Salary”. As we saw in the generic formula for a regression, the independent variable is named by the letter “Y”. Make sure you are selecting only one column with information.
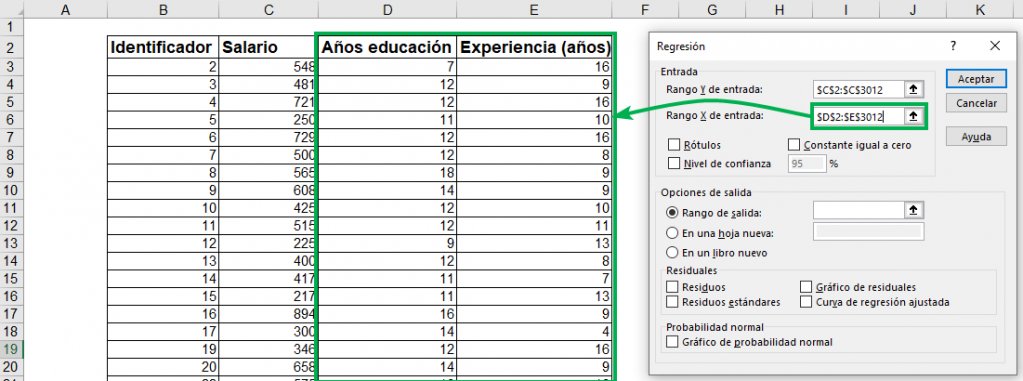
Step 3: Under “Input X Range:”, select all the columns that contain information about the independent variables. In this case, those of “Years of education” and “Experience (years)”. In general, the independent variables of a regression are denoted by an “X”. You can select all the columns you want to incorporate into your analysis. In this case there are only two.
Ninja Tip: If the columns are separated from each other, you can select them with the mouse by pressing the Ctrl key at the same time.
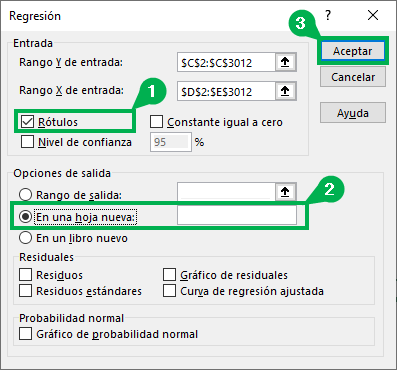
Step 4: Select the rest of the options that you want to incorporate into the results. For this simple case, we will have to select the “Labels” box since the selected columns have the titles. Also, for “Output Options,” select “In a new sheet.” Later we will see some of the remaining options on the spreadsheet. For now, just press “OK.”
The result is as follows:
Interpreting the results of a linear regression with Excel
Now we will review the most important elements of the different tables of regression results.
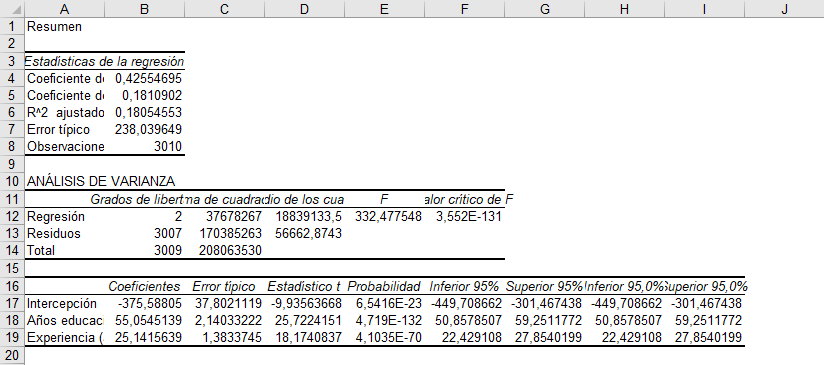
Regression Statistics
This first table includes information about the regression in general and not each of its elements.
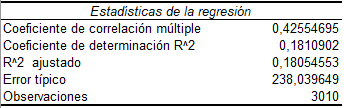
To better understand, we will use the following graph that shows the relationship between salary and education, and the line corresponds to the linear regression that is done on the data.
- Multiple correlation coefficient: It is a measure of how close together the regression variables move. It goes between -1 and 1. If the value is close to 1, it means that the variables move in a similar way. If the value is close to -1, it means that the variables move in the opposite way. If the value is zero, it means that there is no relationship between the variables. In this case, the correlation is 0.426 (approximate), so the variables move in the same direction. Considering the simplified form in the graph, which considers only the relationship between salary and years of education, it means that the slope will be positive.
- Determination coefficient R^2: Esta es una medida mucho más usada e indica qué tan bien se ajusta el modelo. En palabras más simples, significa qué tanto explican la educación y la experiencia, en conjunto, lo que ocurre en el salario. Su valor va entre 0 y 1, y mientras más cercano a 1, las variables independientes explican una mayor cantidad de la variación de la variable dependiente. En este caso el R^2 es más o menos bajo, de 0,181. Esto se puede deber a que faltan otras variables que inciden en el salario de una persona, como puede ser la habilidad, la industria o el sexo.
- Adjusted R^2: Tal como indica su nombre, es similar al R^2 pero este ajusta por la cantidad de variables que tiene la regresión. Esto ocurre porque si se agregan la suficiente cantidad de variables al modelo, entonces el R^2 se acercará cada vez más a 1, aun cuando esas variables sean casi totalmente irrelevantes. Luego, el R^2 “castiga” por la cantidad de variables que tiene la regresión, siendo una medida más estricta de qué tan bueno está el modelo. En este caso, es casi igual que el R^2 ya que el modelo tiene tan solo dos variables dependientes.
- Typical error: It is also known as standard error and corresponds to how much the variables deviate from the prediction made by the regression. To see it more easily, it is the distance that the points (which are the observations) have from the regression line.
- Observations: Simply, the number of rows that the spreadsheet has with data.
Variance analysis
The second regression results table, also known as table ANOVA (by its English name, Analysis of Variance), contains the elements that analyze the variation of the regression, as its name indicates. That is, it indicates how far the data is from the estimate.
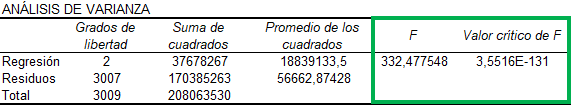
In this case, we will only interpret the result of the F statistic, which is equal to 332.47. This statistic indicates whether all the regression coefficients, together, are different from zero. That is, it indicates whether the coefficient that accompanies “Years of education” AND the coefficient that accompanies “Years of experience” are different from zero, which is the same as saying that they are jointly significant. In general, we want the F statistic to be as large as possible, or we also want the “Critical F Value” to be as small as possible. In this case, we have that the F statistic is 332.48 and that its critical value is practically zero, so we can say that the coefficients are jointly significant.
Coefficients
This table contains what seems like a lot of information, but in reality it contains the point estimate of the coefficients and their significance written in different ways. Let's go step by step.
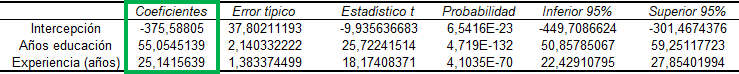
The coefficients column indicates the estimate of the numbers that accompany the regression. The general form would be written:
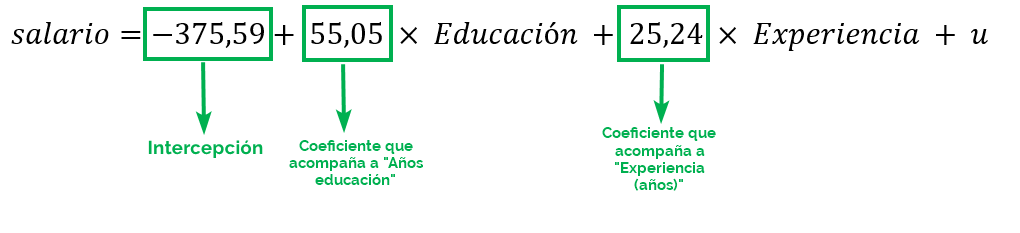
The interpretation of each one is as follows:
- Intercept: indicates what the estimate of the independent variable is when all other variables are equal to zero. In this case, if a person has zero years of education and zero years of experience, then it is estimated that their salary would be -375.59. Although this number may not have practical meaning, it is key to understand its meaning in a regression.
- “Years of education” coefficient: this coefficient indicates that, for each additional year of education, the salary increases by 55.05 units.
- “Experience (years)” coefficient: similar to the previous one, this coefficient indicates that, for each additional year of experience, the salary increases by 25.24 units.
Ninja Tip: The salary can be in different units depending on the country where the information was obtained, such as dollars or pesos. If they were pesos, then the education coefficient is interpreted as “each additional year of education increases the salary by 55.05 pesos.” Make sure you know the units of all your variables to make a correct interpretation.
Significance of the coefficients
You will find the word significance recurrently in any article that talks about regressions. It refers to how certain we can say that the coefficient we estimate is different from zero. For example, if we say “the coefficient that accompanies education is significant,” then that means that we are fairly sure that that coefficient is different from zero. This goes beyond the point estimate of the coefficients (which we just saw just above), but has to do with the different measures that we will see below.
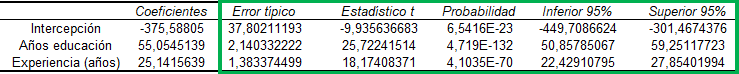
- Typical error: this error indicates the variation in the coefficient estimate. It will be very important when determining significance.
- Estadístico t: es el resultado de la división entre el coeficiente y su error estándar. Es una de las medidas de significancia de los coeficientes. Buscamos estadísticos t que sean grandes en valor absoluto, es decir, muy positivos o muy negativos. Con un estadístico t grande (en general mayor a 2), podemos decir que el coeficiente estimado es distinto de cero, es decir, que es significativo.
- Probability: better known as value-p, is the probability that the coefficient is equal to zero. In general, we want the value-p be as small as possible, specifically less than 0.05. In our case, all values-p of the regression coefficients are very close to zero, so, again, we can say that they are different from zero.
- The columns “Lower 95%” and “Upper 95%” correspond to the confidence intervals of the coefficients. That is, given the point estimate and its standard error, the coefficient moves between those two values. For example, we can say that the coefficient of years of education ranges between 50.85 and 59.25. We see that none of the confidence intervals include zero since, as we had said previously, we reject for all coefficients that they are equal to zero.
Ninja Tip: The estimate of a coefficient may be different from zero, and at the same time it may happen that this coefficient is not significant. For example, consider the case that the education coefficient is 55.05 (the same as what we obtained), but its estimate is so uncertain that its standard error is very large. It is so large that it produces t statistics less than 2, p-values greater than 0.05, and confidence intervals that do include zero. Make sure to always analyze these values when performing a regression.
Analyzing the residuals of a regression
The general form of linear regression contains an element that we have not yet considered: the residuals. These correspond to the difference between the real value of the independent variable and the one estimated by the regression.
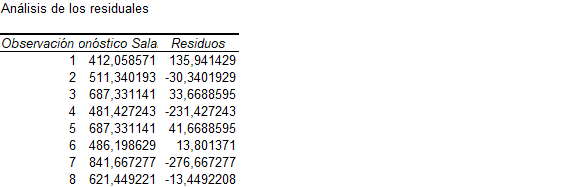
Let's assume the first observation in the table, an individual with a salary of 584, 7 years of education and 16 years of experience. Given the linear regression coefficients, it would be estimated that an individual with those years of education and experience would have 412.06, which comes from the following calculation:
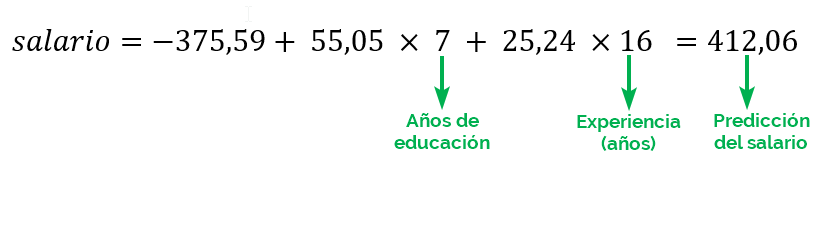
As you will notice, there is a difference between the individual's effective salary and what the regression estimated: 584 – 412.06=135.94. This difference is called a residual, and there is one for each of the observations. You can get this estimate with the additional window elements for performing a regression in Excel.
Step 1: Consider again the window in which the regression data is filled. Select the “Waste” box and then click “Accept.”
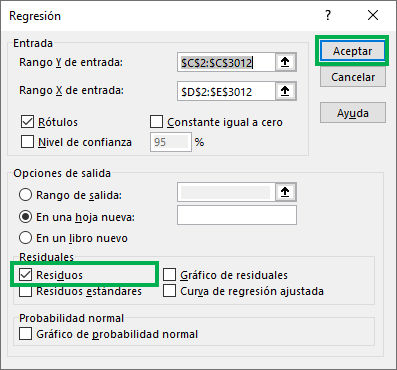
And ready! Now the new sheet contains the result of the regression, but also a new “Analysis of residuals” table that contains the observation, the salary forecast according to the coefficients, and the value of the residual.
Now you have all the basic elements to do a regression and interpret its result.

Carolina Wiegand
Carolina is a doctoral student in Economics at Yale University and a Business Engineer at the Catholic University of Chile. She works with databases doing applied research on education, gender and labor market issues.